Intro
This is a very simple project. Like many others, I found myself stuck indoors during the first few months of the COVID-19 pandemic. Given that I was in university, I wanted to look for a summer job. Unfortunately the economy essentially collapsed that summer and there were no jobs available where I lived, so I had to find other ways to keep busy. I decided to invest that time into myself by practicing programming. This was the summer between my qualifying year of engineering and the first year of my specialization (second year overall), where I was hoping to get into computer engineering. It made sense to keep sharp on the programming since I was going to need it a lot for my upcoming classes.
Around this time I wanted to learn how to use web scrapers for data collection purposes. I also wanted to learn Tkinter for Python. I decided to combine these two things into one project. I came up with the idea for a COVID-19 cases visualizer. It was nice and simple, and incorporated everything I wanted to learn into one project.
The one requirement I had for this project was that it had to update in "real-ish time". Obviously perfect real-time wasn't feasible, but if it had an update frequency of 5 seconds or faster I would be happy. The biggest limiting factor on this speed is how long it would take to fetch data.
Data Source Selection
A big part of making this application work is choosing a good source of COVID-19 data. I wanted a real-time source that would check the data frequently so I could watch the cases rise in real time from my desktop. Thankfully around this time there were quite a few sources popping up all over the internet. I ultimately chose Worldometer as it was updating extremely frequently and gave good breakdowns of the stats. I did try a few other sources that advertised "real-time" data but some of them ended up being difficult/inconsistent to traverse.
For the web scraper itself, I chose BeautifulSoup 4. I had heard a bit about it before and it seemed like a relatively simple option to implement. In particular, I liked how nicely it worked with "idiomatic Python", if that makes any sense. For example, you traverse HTML documents similarly to how you would traverse a tree in Python. I liked this because it made it really easy to do complex traversal and analysis of HTML scraped by BS4.
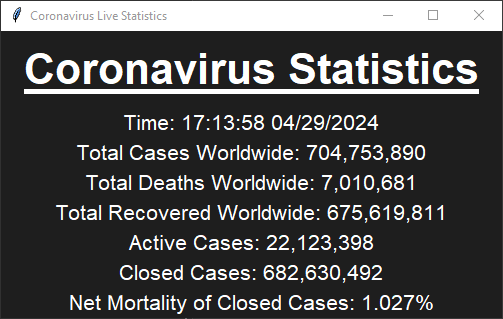
Once I got set up with BS4, the process was pretty simple honestly. I spent about 30 minutes getting the library up and running, and slowly working my way through Worldometer's HTML code. Since Worldometer has a very simple website, it was easy to traverse and find where the COVID data was in the HTML. From there, it was easy to create a routine that fetched the number of cases, resolved cases and deaths at any time. This routine runs once every 4 seconds, resulting in what I described above as "real-ish time".
The Code
You can find the code for this project on my GitHub. It's honestly not anything to write home about given that I wrote it fresh out of first-year, but I still find it interesting nonetheless.